Water weight and the scale
Why You Gained 2kg Overnight (Not Fat)
Why you gained 2kg overnight is water weight from salt or carbs, not fat. See the calorie math that proves it, with sources.
Guides
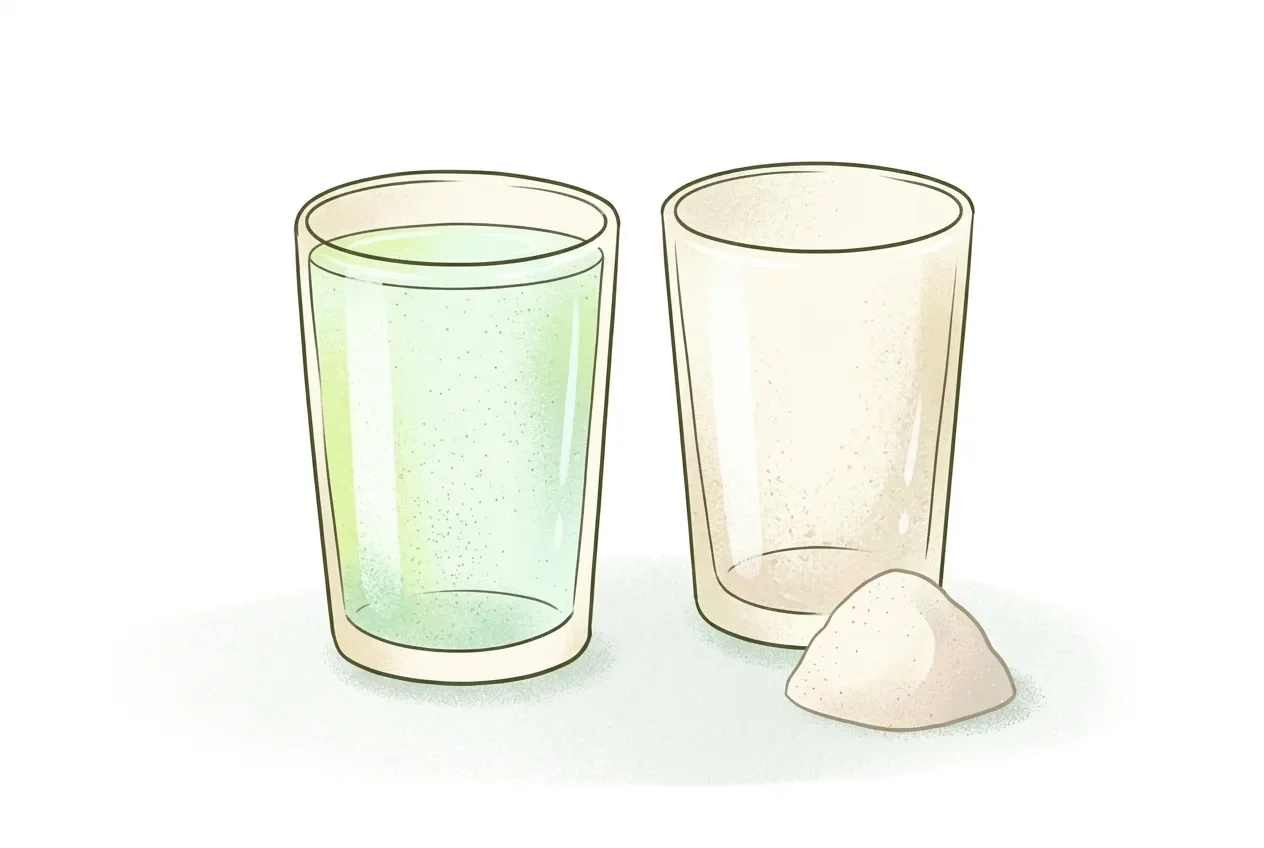
Why am I gaining weight in a calorie deficit? The scale weighs water, glycogen, food in transit and salt as readily as it weighs fat. Those can shift by a kilo or more from one day to the next. True fat loss is far smaller and only shows up over weeks. A 0.8 kg rise three weeks into logging almost never means the deficit failed. It usually means one of these heavier, faster-moving things went up first.
The scale reads total mass on the platform, not fat. Body water, the glycogen it clings to, food still in the digestive tract and sodium-driven fluid all weigh something. All of them change faster than fat does.
A calorie deficit burns fat slowly, in small amounts per day. The other four factors can each swing a kilo or more within 24 to 48 hours. When several move the same direction at once, the scale rises even while fat is quietly dropping underneath.
That is not a flaw in the deficit. It is the scale doing what it is built to do: weigh everything on it, not sort it into categories.
Muscle stores carbohydrate as glycogen, and glycogen does not sit alone. Research on recovery from exercise found stored glycogen holds roughly 3 grams of water per gram, rising toward 1:17 with full rehydration (Fernández-Elías et al., 2015).
A new training block or a carbohydrate-heavier day can add several hundred grams of stored carbohydrate. At 3 grams of water per gram of glycogen, that alone can add close to a kilo of scale weight with no fat gained at all.
Starting or intensifying training also causes small tears in muscle fibres. The repair process draws fluid into the area, and that fluid registers as body mass just like water anywhere else. Combined with glycogen-water, a first week of new training can plausibly add close to a kilo of fluid.
This matters most in the first two to three weeks of a new routine or a new logging habit. Once glycogen stores and training adaptation settle, this swing settles too.
Sodium pulls water with it. A UK research body focused on salt and health states the body retains roughly 1.5 litres of fluid while salt intake stays elevated (Action on Salt, Queen Mary University of London).
A litre and a half of retained fluid weighs about 1.5 kg on its own, since water's density is close to 1 kg per litre. A single salty meal or a run of higher-sodium days can nudge the scale that way with no change in fat.
EU rules give a fixed way to read a label's salt content: salt equals sodium multiplied by 2.5, declared per 100 g or 100 ml (Regulation (EU) No 1169/2011). That connects a label's sodium figure to how salty a meal actually was.
Food and fluid also sit in the stomach and intestines for hours before digestion finishes. A large meal or a fibre-heavy day can shift gut contents by several hundred grams in either direction, none of it fat.
The deficit size and the number of days in this example are illustrative. They are chosen only to make the arithmetic reproducible, not as a target to follow.
A commonly used illustrative estimate for adipose tissue energy density is roughly 7,700 kcal per kilogram, a rounded figure long used in weight-change arithmetic.
A separate measurement exists for a different quantity. That quantity is the excess tissue composite gained in obesity, adipose tissue together with the extra skeletal muscle, skin, liver, bone and other organs that come with it, not fat tissue alone. That composite's metabolizable energy has been measured at roughly 4,562 kcal per kg in men and 5,525 kcal per kg in women (Hwaung et al., 2019, Obesity). It runs lower than the 7,700 kcal/kg figure partly because it includes non-fat, water-rich tissue alongside the fat.
Using the illustrative 7,700 kcal/kg figure, a reader who illustratively ran a 500 kcal/day deficit for 5 days would total 500 × 5 = 2,500 kcal, or 2,500 ÷ 7,700 ≈ 0.32 kg of fat lost. The two figures are not interchangeable measurements of the same tissue, so this article uses only the 7,700 kcal/kg constant for the worked sum. Either way, the scale rose 0.8 kg over the same days, several times the fat this illustrative deficit accounts for.
A logging gap can produce a similar mismatch between the number eaten and the number that mattered. Working through a homemade dish's calories step by step is a reasonable next step if a reader wants confidence the deficit itself is being counted correctly.
| Source of the change | Illustrative or sourced mass | Typical duration |
|---|---|---|
| Glycogen-water (new training or carb-heavier days) | up to ~1 kg (sourced ratio) | days to 2-3 weeks |
| Sodium-driven fluid retention | ~1.5 kg (sourced) | while salt intake stays elevated |
| Food and fluid in the gut | several hundred grams (illustrative) | hours |
| Exercise-repair fluid | up to ~1 kg (illustrative) | first 1-3 weeks of new routine |
| Fat lost, 5 days at illustrative 500 kcal/day deficit | 0.32 kg (at 7,700 kcal/kg) | ongoing, slow |
The masking factors alone can add up to several times the fat actually lost over the same days. The 0.8 kg rise is easily explained without the deficit failing.
A cohort of 80 adults, tracked across 4,657 daily weigh-ins over 15 to 330 days, found weight peaks around Sunday or Monday. It drifts down through the week, most clearly in people losing or maintaining weight (Orsama et al., Obesity Facts, 2014).
That weekly rhythm appeared in people whose weight was, on average, going down. A single day's reading sits inside that noise. The trend across several weeks carries the signal a daily number cannot.
Three weeks of logging with one high morning is not enough to separate a real stall from an ordinary water swing riding on top of slow, real fat loss.
Watch the direction across weeks, not the value on any single day. A number that is higher three weeks in says little on its own, given everything above that moves faster than fat.
Avocalo tracks weight alongside meals and shows the trend over 7, 30 and 90 days, letting a reader track the 7, 30 and 90-day weight trend in Avocalo instead of reacting to one morning's reading. It makes no accuracy claim about that trend, it only shows the pattern in the numbers already logged.
A given volume of muscle is denser than the same volume of fat, but that is not what is happening here. Glycogen-water, sodium and gut contents change within days, while measurable muscle gain takes much longer to build.
Daily weighing is fine as long as one reading is not treated as proof of anything. The weekday weight-rhythm study above found daily swings sit on top of a real weekly trend, so daily numbers are most useful read as a trend, not individually.
Yes, in aggregate. One day's number carries the noise from the factors above, but a week's or month's average filters that noise out. That is the pattern the cited cohort study found across its 4,657 measurements.
Stress and poor sleep are sometimes discussed alongside water retention elsewhere, but this article's sources did not include a specific figure for that mechanism. No number is given here for that reason.
New training causes small muscle-repair processes that draw in fluid, on top of glycogen refilling. Both add water weight, not fat. This combination is common in the first one to three weeks of a new routine and settles as the body adapts.
Use the recipe-portion calculator to check a homemade dish's calories per serving if a logging gap, not water, might be the real explanation.
See our editorial policy for how figures are sourced and checked. Published by Petros IT Solutions SRL. Spotted an error? Write to [email protected].