Water weight and the scale
How Much Weight Do You Gain on Your Period?
How much weight do you gain on your period? See the study behind the measured 0.45 kg fluid rise, why it happens, and when it clears.
Guides
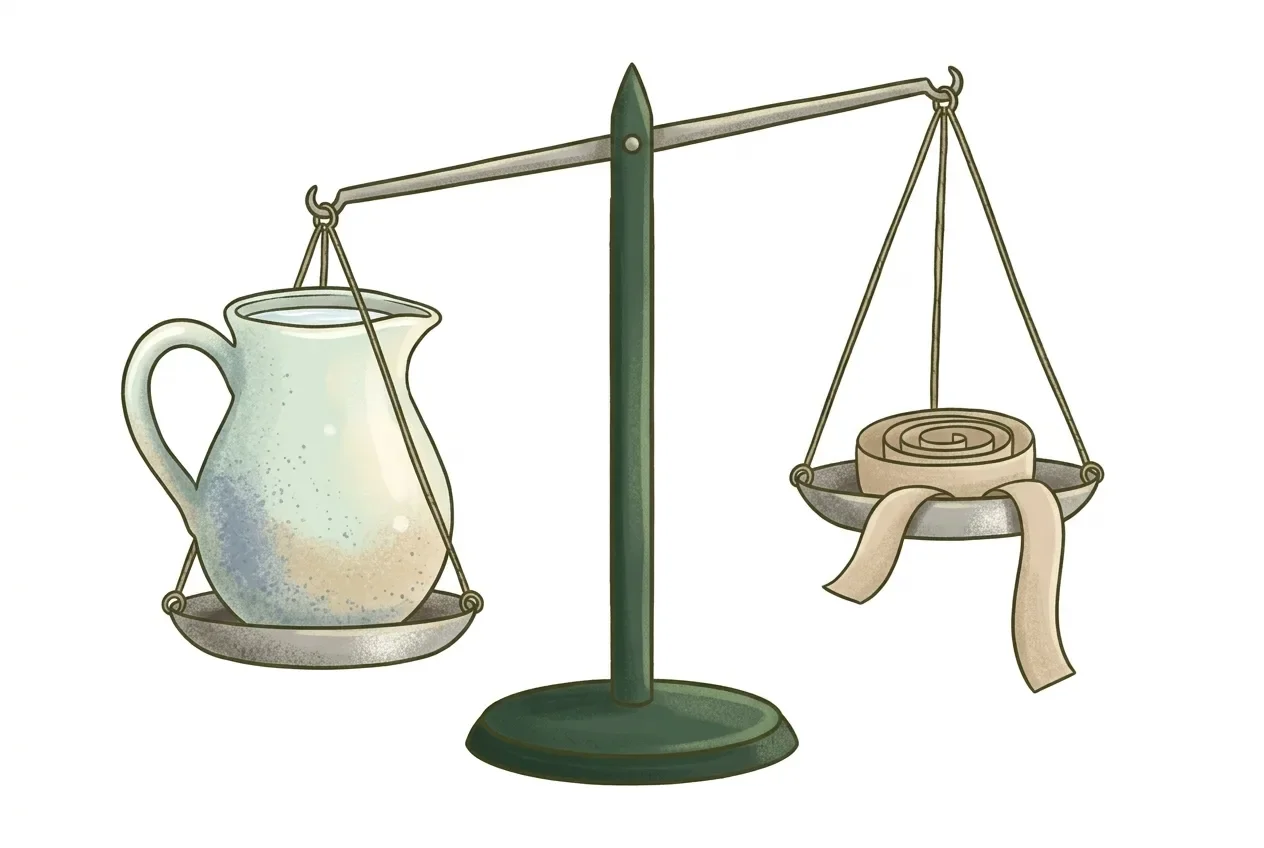
Losing inches but not weight usually means the scale is picking up water and lean tissue while your jeans respond only to shape. Neither number is lying. They measure different things: total mass on the scale, versus the volume your body takes up in your clothes.
The scale adds bone, organs, food in transit, water, glycogen, fat and muscle into one number. A tape measure or a pair of jeans responds to volume, and volume depends on what kind of tissue sits where.
Six weeks into a new training routine, the mechanisms below point most often to water. Starting resistance training stores extra water in muscle within days, before any fat has changed and before muscle has visibly grown (Fernández-Elías et al., 2015; Abe et al., 2000). That water adds kilograms the scale sees and inches nowhere, while any fat lost still shows in the waist.
The scale adds up mass. A tape measure or a mirror reports shape, which depends on density, not mass alone. Two tissues can weigh the same and take up different room.
Fat-free tissue (muscle, organs, water-rich tissue) has a density of about 1.10 g per cm³ in the standard body-composition model. Fat tissue is lighter, about 0.90 g per cm³ (Siri, 1961; Brozek et al., 1963, as summarized in Wang et al., American Journal of Physiology). A kilogram of the denser tissue simply occupies less space.
If training swaps some fat for lean tissue, the scale number can hold steady. It can even rise. This happens if the routine also adds water and a little muscle while fat drops. The scale can rise even as the body measures smaller. Neither number is wrong. They answer different questions.
Starting a new workout routine, especially one with new resistance exercise, makes muscle store more glycogen, the form your body keeps carbohydrate in for fuel. Glycogen does not sit dry. Water binds to it.
A 2015 study measured this directly. Cyclists who dehydrated through prolonged exercise and then rehydrated only partially still rebuilt glycogen at a ratio of about 3 grams of water for every gram of glycogen stored. Fully rehydrated, the ratio climbed to about 17 grams of water per gram of glycogen (Fernández-Elías et al., European Journal of Applied Physiology, 2015).
That is a wide range, and it depends on how much fluid someone drinks, not a fixed number anyone can expect on a given week. But it shows the mechanism: refilling glycogen stores after new or harder training pulls water in with it, and that water registers on the scale immediately, well before any fat or muscle change would.
Slower than the water shows up. A study following 17 men and 20 women through 12 weeks of structured resistance training, three times a week, at 8 to 12 repetitions to fatigue, tracked both strength and muscle thickness by ultrasound at multiple sites (Abe et al., 2000).
Strength increased first: significantly by week 2 in men's knee extension, by week 4 for women on chest press and knee extension, and by week 6 for men's chest press. Muscle thickness changes lagged behind. That is one study of one protocol, not a promise of anyone's own timeline.
In that specific protocol, most of what moved in the first six weeks was strength, not visible muscle thickness. So in a routine built the same way, a heavier scale after six weeks is more plausibly water retention than muscle already added, and the loosening jeans more plausibly reflect fat loss than a body already rebuilt in lean tissue.
The starting weights below are illustrative, chosen to make the arithmetic simple; the densities are the sourced figures. Say someone lost 1 kg of fat and gained 1 kg of lean tissue (muscle plus its stored water) over six weeks. The scale would show no change at all, yet the body would look smaller.
Using the two sourced densities:
| Tissue | Density | Volume of 1 kg |
|---|---|---|
| Fat (0.90 g/cm³) | 0.90 g/cm³ | 1,000 g ÷ 0.90 g/cm³ ≈ 1,111 cm³ |
| Fat-free tissue (1.10 g/cm³) | 1.10 g/cm³ | 1,000 g ÷ 1.10 g/cm³ ≈ 909 cm³ |
(Siri, 1961; Brozek et al., 1963, as summarized in Wang et al., American Journal of Physiology)
The difference is 1,111 minus 909, about 202 cm³, roughly 18% less volume for the same 1 kg. That is why a kilogram swapped from fat to lean tissue can shrink a waistline even though the scale does not move.
Now add water. If a new routine pulls in an illustrative 0.5 kg of glycogen-bound water in the first weeks, the scale reads 0.5 kg higher even while the swap above is shrinking the waist. The scale sums both effects; the tape measure only sees the fat-to-lean swap. That is the whole mismatch in one sum.
Avocalo logs weight and activity and shows statistics over 7 days, 30 days and 3 months, which is where a trend, not a single reading, becomes visible. That view lives inside the app. The weight trend and plateau check does the same job in the browser: paste weigh-ins and see the 7-day average, the smoothed trend and whether a flat spell is a real plateau.
Neither the app nor the tool can tell fat from water from muscle. A tape measure around the waist is the outside check this article has argued for throughout. Hold it to the same spot each time. It works alongside either the app or the free tool, not instead of one or the other.
Avocalo also offers photo-based meal logging: photograph a plate, review the AI's estimate, and adjust it before saving. That estimate comes from reading the image, not a lab measurement, and it is separate from the weight and water question this article answers. You can log meals and weight in Avocalo to keep both in one place.
It is not evidence of failure. If the waist or clothes fit looser while the scale holds steady or rises, that pattern is consistent with fat loss happening alongside water retention or a small lean-tissue gain, based on the density and glycogen mechanisms above. It is not proof on its own; the multi-week trend is what confirms it.
The cited study measured the glycogen-water ratio at a single point after exercise and rehydration, not how long it persists across weeks of a new routine. No source here quantifies how many weeks it takes for this water effect to settle as the body adapts.
Unlikely this early. The muscle-thickness data available shows meaningful growth lagging behind strength gains over 12 weeks (Abe et al., 2000), while glycogen-bound water shows up within days of new training. Six weeks in, water is the more plausible larger contributor to any scale increase, based on those two timelines.
The cited glycogen-water mechanism applies to any activity that depletes and rebuilds muscle glycogen, which includes both resistance and endurance training. The strength and muscle-thickness study specifically used resistance exercise, so the muscle-tissue timeline described here is best applied to that kind of training.
Weight follows a weekly rhythm, rising through the weekend and falling across the week, found in a study of 80 adults with thousands of weigh-ins (Orsama et al., 2014). A single day's number reflects that rhythm as much as anything about fat or muscle.
Published by Petros IT Solutions SRL. Corrections: [email protected].