Counting calories
Does Skipping Breakfast Slow Your Metabolism?
Does skipping breakfast slow metabolism? RCT data show resting metabolic rate barely changes. See the trial numbers and a worked example.
Guides
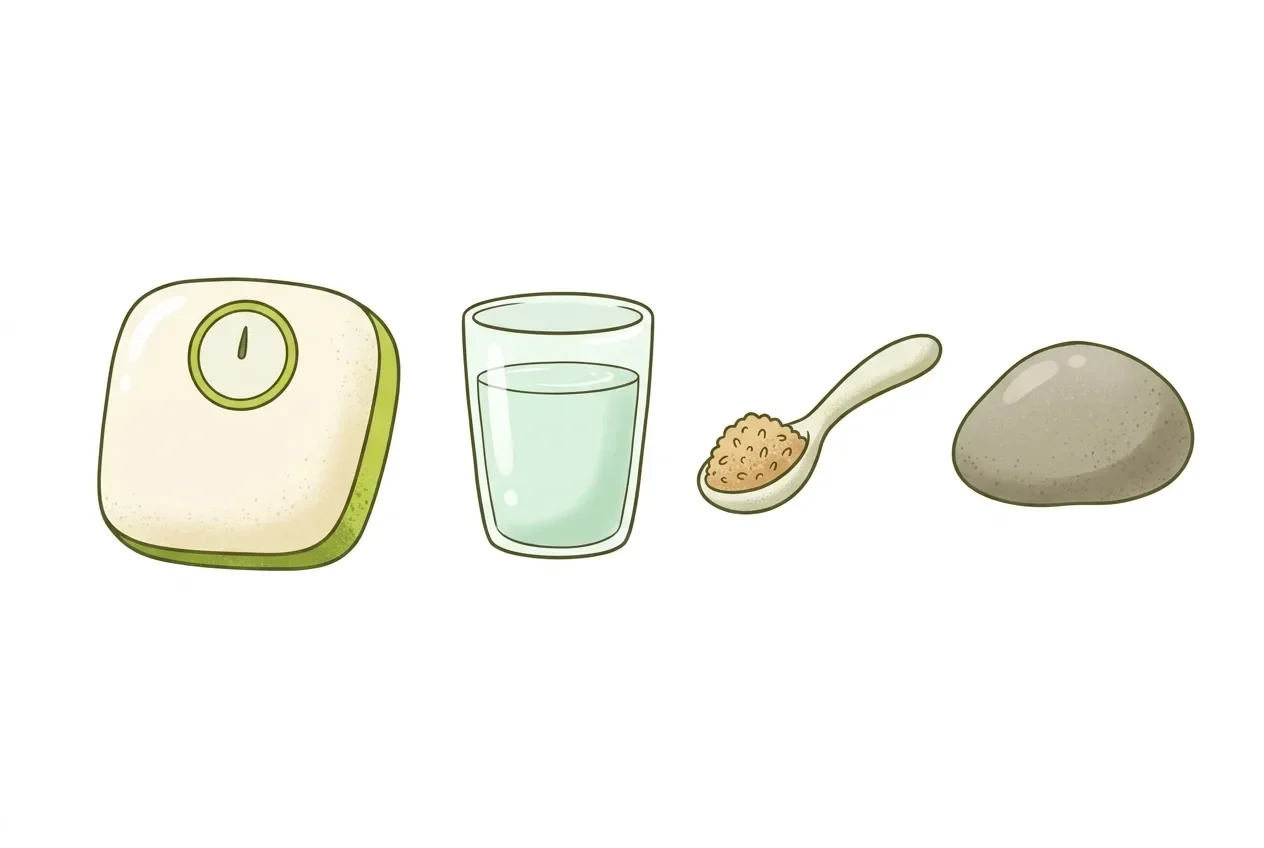
Most stalls come from water retention, a small counting drift, or a real but modest metabolic slowdown, not fat regain. You stopped losing weight because one or more of these three things shifted at once. The scale cannot tell them apart on its own.
Water weight can hide several days of real fat loss behind a flat or rising number. A gap between what you log and what you actually eat can close a deficit without you noticing. And after significant weight loss, the body does burn a bit less energy than its size alone predicts.
None of these means fat came back. Counting more precisely for a week or two usually shows you which one is happening. Then you can stop guessing and start checking why weight loss stalled for you specifically.
No. A stalled scale means your weight is not moving in either direction, not that fat mass increased.
Fat gain requires eating more energy than you burn, over time. It has to show up as an actual upward trend. A short plateau, even one lasting two or three weeks, sits inside normal day-to-day fluctuation for water, food volume in the gut, and hormonal cycles.
The scale reacts to a lot that is not fat. This is exactly why the next few sections separate the noise from the signal, one mechanism at a time.
Water retention can hide a meaningful amount of real fat loss behind a stalled number. That is because muscle stores glycogen with a water debt attached.
Muscle and liver glycogen bind water at roughly 3 to 4 grams of water for every 1 gram of glycogen, according to the classic Olsson and Saltin study on total body water and glycogen (Acta Physiologica Scandinavica).
That means a swing in carbohydrate intake, sodium, or training volume can change glycogen stores by 100 to 200 grams in a day. The next figure is illustrative, to show the arithmetic: at the low end of that 3:1 ratio, a 150 gram glycogen swing carries roughly 450 grams of water with it. A single higher-carb meal, more sodium, or a rest day after hard training can shift the scale by that much without touching body fat at all.
This is why the scale can sit still, or even rise, for several days while fat loss continues underneath it.
Metabolic adaptation is real, but it is a small drag, not a stall on its own. A randomized controlled trial in 71 adults with obesity measured it directly.
After 8 weeks on a 1,000 kcal/day diet, participants lost 14.1 ± 0.4 kg, about 13.2% of body weight. Their metabolic rate had adapted downward by -91.5 ± 110.4 kcal/day beyond what their new, smaller body size alone would predict (Nutrition & Metabolism).
The same study found each additional 50 kcal/day of adaptation was linked to about 0.5 kg less fat mass lost on the same diet. That link held among the participants in that one trial, not as a comparison across different amounts of weight loss.
This trial only measured people after they had already lost about 13% of body weight. It had no comparison group with smaller weight loss, so we cannot say from this data how large the effect would be earlier in a diet.
Ninety-one kilocalories a day nudges progress. Over a two-week stall it adds up to roughly 1,280 kcal, a fraction of the deficit needed to explain a full plateau by itself.
Yes, and it can happen without anyone noticing. A systematic review of food and beverage intake misestimation looked at how far reported portions drift from actual weight, by food type (Advances in Nutrition).
The review found the size of the error depends heavily on the food. Portion misestimation explained as little as 20% of the error for vegetables, but as much as 99% for sweets. Most individual portion guesses still landed within 50 grams of the true weight.
The review reports that the proportional error was highest in the condiments group and the nuts and seeds group. These are foods without a clear, countable unit, poured or scooped rather than portioned as a single item.
Homemade meals are where this gap tends to open widest, since there is no label to check against. Our guide on how to count calories in homemade food walks through adding up a recipe and splitting it into servings, step by step.
If you want to check a specific dish's calories per serving once you know its total, the free recipe-portion calculator divides that total across servings, or by cooked weight, without needing to look anything up.
One input in the table below is illustrative, marked as such. The fat-tissue conversion below the table uses a commonly cited approximation, kept separate from the sourced figures above it.
| Mechanism | Size in this scenario | Source |
|---|---|---|
| Glycogen-linked water (150 g glycogen swing, illustrative) | ≈450 g water | 3 to 4:1 ratio, Olsson & Saltin, 1970 |
| Metabolic adaptation over 14 days | -91.5 kcal/day × 14 ≈ 1,280 kcal | Nutrition & Metabolism RCT |
| Portion misestimation, condiments or nuts/seeds | highest proportional error of any food group | Advances in Nutrition review |
The 1,280 kcal figure uses only the RCT's own daily rate multiplied by 14 days. Converting that into a fat-mass equivalent needs an energy-density figure for fat tissue.
One widely used value is the ≈7,700 kcal/kg approximation, tracing to Wishnofsky's 1958 paper on the caloric equivalents of gained or lost weight (Wishnofsky, The American Journal of Clinical Nutrition, 1958, DOI 10.1093/ajcn/6.5.542, PMID 13594881). That paper derived roughly 3,500 kcal per pound of adipose tissue, which converts to about 7,700 kcal per kilogram. It is a long-standing approximation, not a figure measured in the RCT above.
Using it only for illustration, 1,280 kcal works out to roughly 166 g, well under half a kilogram over two weeks.
If you eat consistently and your weight jumps around by under a kilogram day to day, water is the likely explanation. Weigh yourself at the same time each morning for a week and look at the trend line, not any single day.
If the stall has lasted two weeks or more and your weight is flat rather than bouncing, check your counting first. Condiments and nuts and seeds carried the largest proportional estimation error in the review above. Sweets carried the largest share of variance in energy-intake error on a separate measure in the same review. Start by weighing all three rather than eyeballing them.
The RCT measured its adaptation effect only after a substantial 13.2% weight loss, with no smaller-loss comparison group. A more modest effect earlier in a diet is a reasonable expectation from that gap, not a measured finding. If you have already lost a large share of your starting weight and your counting is careful, the slowdown itself may be a real part of the answer.
This also explains why you might be losing inches but not weight. A body recomposing toward more muscle and less fat can shrink in measurements before the scale reflects any change, since the two track different things. Water fluctuations described above mask this too, since a tape measure is less sensitive than the scale to a single day's glycogen or sodium swing.
Avocalo lets you photograph a meal and get an estimate of calories, protein, carbohydrates and fat from that image. You can review and edit the result before saving it. This is useful for comparing what you assumed you ate against what a fresh look at the plate suggests, especially for the condiments and sauces the research above flags as easiest to misjudge.
The estimate comes from the app's reading of the photo, not from weighing the food or matching it to a nutrition database. It cannot know hidden oil or an exact portion size. It is a comparison tool, not a scale. Download Avocalo to try photo logging yourself and start checking your own portions this way.
Muscle gain requires a deliberate training stimulus and takes weeks to add meaningful mass. A sudden stall is better explained by the water and counting mechanisms above, which can shift the scale within a day, than by muscle change, which builds up gradually.
No, it cannot undo fat loss, though it can hide it on the scale. A higher-sodium or higher-carbohydrate day increases water retention through the glycogen-water relationship described above, showing up as a heavier number without any change in body fat.
It is unlikely for a small amount of weight loss. The RCT measured its adaptation effect, -91.5 kcal/day, only after a substantial 13.2% body weight loss, with no comparison group at a smaller loss.
Neither alone tells the full story. The scale reacts quickly to water and food volume. Measurements shift more slowly with real changes in fat and muscle. Tracking both over two or more weeks beats either one on a single day.
Published by Petros IT Solutions SRL. Send corrections to [email protected].