Nutrition labels
How Much Protein Is in Greek Yogurt?
See exactly how much protein greek yogurt has per serving, with the straining math and a sourced comparison to regular yogurt.
Guides
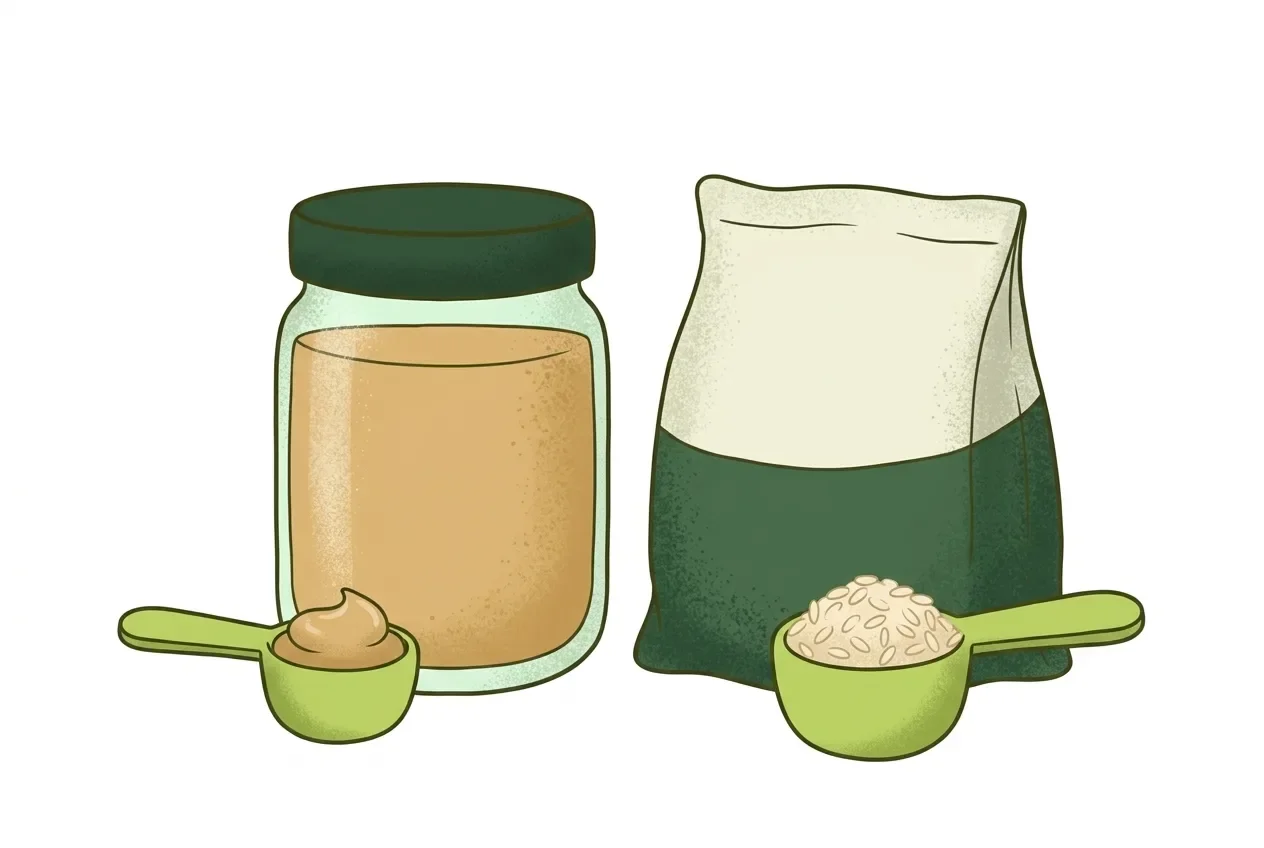
Two protein numbers appear because two different questions need two different answers. Use the per-100g figure to compare foods against each other. Use the per-serving figure to log the portion you actually ate, but only after you check what that serving weighs.
A label's per-serving column tells you the protein in one package-defined portion. The per-100g column tells you the protein in a fixed, universal amount.
They diverge because a serving size is not standardized weight. In the US, the FDA requires serving sizes to reflect "the amount of food people typically consume, rather than how much they should consume" (FDA, Serving Size on the Nutrition Facts Label). That typical amount differs by food and over time.
To illustrate: a 32g serving of one food and a 46g serving of another are not comparable on their face, since the portion weights themselves differ. Per-100g strips out that serving-size variable entirely, so the same weight of two different foods sits side by side.
Use per-100g when you are comparing two products, and per-serving when you are logging exactly what you ate, provided you know the serving's real weight.
Per-100g is a fixed yardstick. Regulation (EU) No 1169/2011 makes it the mandatory reference on EU labels: Article 32(1) requires nutrient values "per 100 g or per 100 ml" (EUR-Lex, Regulation 1169/2011).
Per-serving is closer to what a scale would show if you weighed your actual plate. But this only holds if your portion matches the label's stated serving weight. If you eat more or less than that weight, the per-serving number no longer describes your meal, and you need to convert it.
Cooking also changes how concentrated protein looks per 100g, a separate effect from serving size. See how cooking method changes the protein reading on chicken for a worked example of that effect.
Take the per-100g protein figure, divide by 100, then multiply by your portion's weight in grams.
The formula is: protein in your portion = (protein per 100g ÷ 100) × your weight in grams.
As an illustrative example, say a food lists 20g protein per 100g and you weigh out 50g. That's (20 ÷ 100) × 50 = 10g protein.
This works regardless of what the package's stated serving size happens to be. It starts from the fixed per-100g reference rather than from a manufacturer's portion choice. Once you have grams of protein per 100g and the weight on your kitchen scale, that division is the whole method, no tool required.
US labels lead with a single, manufacturer-based serving figure as the primary declaration. EU labels lead with per-100g by law, and a serving figure is optional beside it.
The EU's Article 32(1) makes per-100g the mandatory declaration on every label (EUR-Lex, Regulation 1169/2011). Article 33 lets a manufacturer add a per-portion figure alongside that mandatory per-100g declaration for the core nutrients.
US regulation takes the opposite emphasis. Under 21 CFR 101.9, the per-serving figure based on a reference amount is the required, near-universal format. An additional per-100g column is permitted as an optional format, but it is rarely used in practice. Most US labels show only the per-serving figure, so don't expect to find a per-100g row. When it is missing, use the conversion formula from the previous section instead.
A reader buying an imported US snack in an EU country may see both conventions on different packaging for the same category of food.
No, not arbitrarily. Under US rules, the serving size has to reflect what people actually eat. That reference amount can change over time as eating habits shift.
The FDA's own consumer update describes exactly this. The reference serving size for individually packaged yogurt moved from an 8 oz container to a 6 oz container, because consumption patterns changed (FDA, "Food Serving Sizes Have a Reality Check"). A manufacturer did not invent that number. The reference amount itself was updated by regulation.
This matters for comparing protein. The same product bought years apart can carry a different serving weight on the label. That is exactly why per-100g stays the more stable number to compare against.
The following figures are illustrative, invented to demonstrate the arithmetic, not measured from a specific product record.
| Food | Protein per serving | Serving size | Protein per 100g |
|---|---|---|---|
| Peanut butter | 7.0 g | 30 g | 23.3 g |
| Rice, cooked | 3.0 g | 50 g | 6.0 g |
The two numbers on each row describe the same food, scaled differently. For the peanut butter: 7.0g ÷ 30g × 100 = 23.3g, matching the per-100g figure on the same row.
Now compare the two foods fairly. At 100g each, peanut butter carries 23.3g protein against rice's 6.0g. The per-serving row alone would understate this difference, since the servings themselves differ in weight, 30g versus 50g.
If you ate 60g of the rice rather than the labeled 50g serving, the per-serving figure of 3.0g no longer applies. Using the per-100g method instead: (6.0 ÷ 100) × 60 = 3.6g protein, the number that matches what you actually ate.
To check this arithmetic against a real label, use Avocalo's free nutrition label calculator, which converts a label's per-100g or per-serving figures into your actual portion.
Avocalo's manual logging lets you search a food database for packaged foods. It's built from Open Food Facts, USDA FoodData Central and national food-composition tables, so you can find a product's figures without doing the per-100g conversion by hand.
Avocalo's photo logging works differently. You photograph a meal, and an AI vision model estimates the foods, portions, calories and macros from the image. It does not look up or match against a nutrition database, so it cannot read a label's numbers directly. For a packaged food where the label matters, search for it or log it manually in the app instead.
Either way, the estimate you review and edit before saving is yours to correct against the label in front of you. Download Avocalo to try either method.
Some US labels show only per-serving figures. If the label states the serving weight in grams, you can still calculate an equivalent per-100g figure yourself. Divide the per-serving protein by the serving weight, then multiply by 100, the same arithmetic shown in the worked example above.
Yes. Every nutrient on the label is subject to the same per-serving versus per-100g split, not just protein. This follows from both US serving-size rules and EU Regulation 1169/2011's Articles 32 and 33, so the same conversion method applies to carbohydrate and fat figures too.
Reference serving sizes are periodically updated to reflect actual consumption patterns. The FDA's own example moved yogurt's reference serving from 8 oz to 6 oz containers, so a product you've bought before can carry a different serving size on a newer label.
A photo estimate comes from the model reading the image, not from the printed label, so it cannot use the label's per-100g or per-serving figures directly. Searching the food database lets you find figures sourced from Open Food Facts, USDA FoodData Central, or national tables instead.
This article follows Avocalo's editorial policy. Spot an error? Write to [email protected].
Published by Petros IT Solutions SRL.