Photo calorie estimates
How Do AI Calorie Counters Actually Work
How do AI calorie counters work? See the three-stage photo pipeline, its sourced error rates, and why review still matters.
Guides
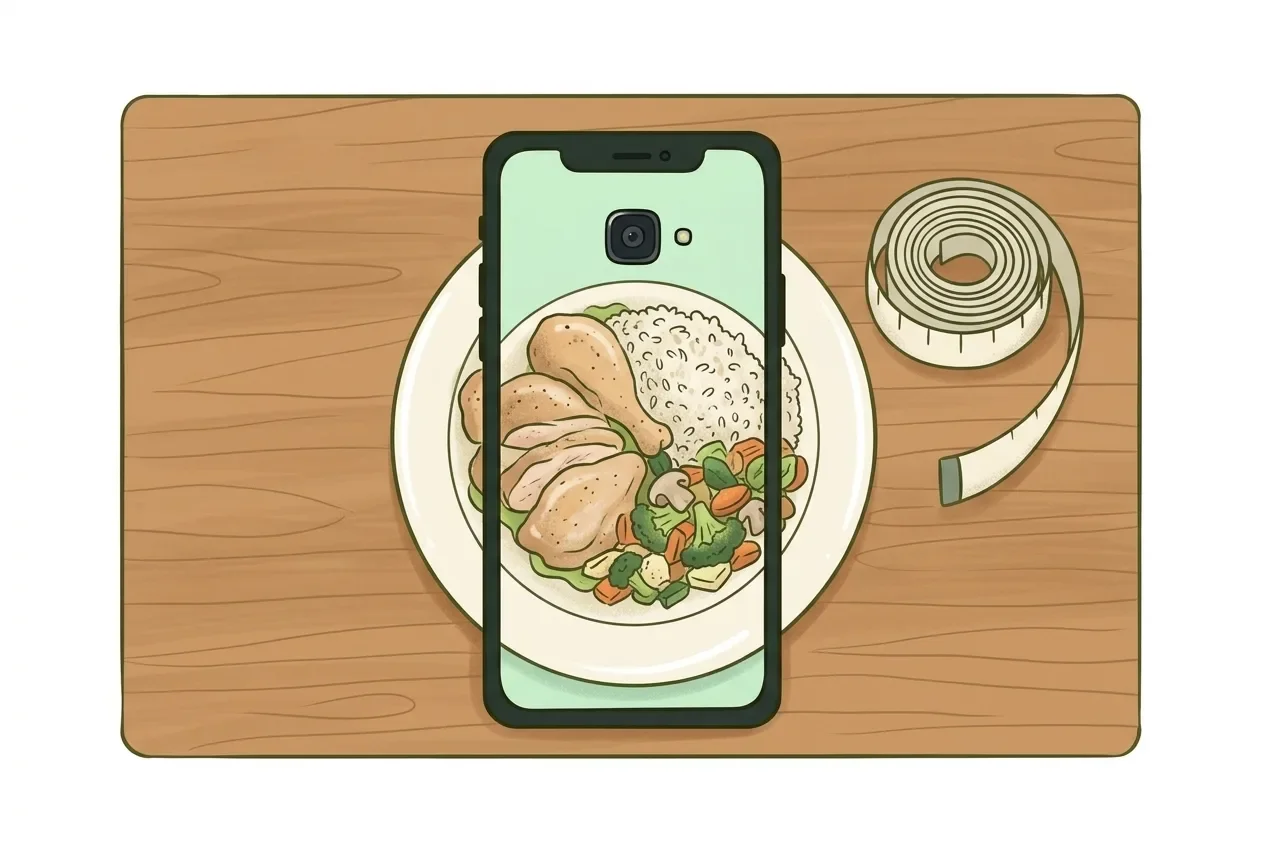
ChatGPT can count calories from a photo, and often names the foods correctly. In one peer-reviewed test, GPT-4 identified foods on real meal photos with 93.0% precision and 84.6% recall, an F1 score of 88.6% (O'Hara et al. 2025, Nutrients). What it struggles with is the number attached to that food: portion size, hidden fat, and getting the same answer twice. For the full pipeline behind these numbers, see how the three-stage photo pipeline behind these estimates actually works.
Yes. Paste a photo of a plate and ChatGPT will name the dish, list rough ingredients, and give a calorie and macro estimate. That part works because vision models are good at recognizing food.
The harder task is not naming rice and chicken. It is weighing them from a flat image with no scale, no depth sensor, and no idea how much oil went into the pan. That is where the number starts to drift from reality.
Published research gives a concrete answer instead of a guess. In a 114-photo study, ChatGPT-4 underestimated total meal weight in 76.3% of photographs, 87 out of 114 (O'Hara et al. 2025, Nutrients).
Across all 114 photographs combined, the absolute percentage difference between ChatGPT's estimated weight and the measured weight averaged 27.8%, with a standard deviation of 18.5%. That single number blends every portion size together.
Broken down by portion size, the pattern sharpens. Small portions were not significantly different from measured weight (p=0.221). Medium and large portions were significantly underestimated instead (p<0.001), though the paper does not report a separate mean error percentage for each size band.
Agreement with dietitians' own estimates, measured by intraclass correlation, was 0.56 for energy, a range the study describes as poor to moderate. Protein came out slightly better at 0.67, moderate to good, while carbohydrate agreement was just 0.31, poor.
A separate hospital-meal study tested ten models in total: three general-purpose multimodal models and seven specialized dietary apps. Among the three top-performing models analyzed in detail, including GPT-4o, correlation with dietitians ranged from 0.82 to 0.89 for energy but only 0.41 to 0.48 for fat (Isobe et al. 2026, Nutrients). Energy looks decent on average. Individual nutrients do not.
Lining up the studies' figures side by side shows a pattern no single one states on its own.
| Metric | Finding | Source |
|---|---|---|
| Food identification (F1) | 88.6% | O'Hara et al. 2025, Nutrients |
| Meals with underestimated weight | 76.3% (87/114) | O'Hara et al. 2025, Nutrients |
| Mean weight error, all portions combined | 27.8% ± 18.5% | O'Hara et al. 2025, Nutrients |
| Small vs medium/large portion error | Not significant (p=0.221) vs significant (p<0.001) | O'Hara et al. 2025, Nutrients |
| Energy agreement with dietitians (ICC) | 0.56 | O'Hara et al. 2025, Nutrients |
| Fat overestimation bias | 33.8% to 52.3% | Isobe et al. 2026, Nutrients |
| Fat correlation with dietitians, top 3 models | 0.41 to 0.48 | Isobe et al. 2026, Nutrients |
| Same photo, repeated queries | Does not return one fixed number | Wang, Lane & Waki 2026, JMIR Diabetes |
Food identification is the strongest link in the chain. Portion size and fat content are the weakest, and reproducibility sits underneath all of it.
The pattern is not random, it is tied to portion size. Across all 114 photos, the mean absolute weight error was 27.8% ± 18.5%, but that figure covers every plate together, not one size specifically.
Split by size band, small portions were not statistically different from measured weight (p=0.221). Medium and large portions were significantly underestimated (p<0.001) (O'Hara et al. 2025, Nutrients).
A model reading a flat photo has no ruler and no depth information. A small pile of food looks roughly like what it is. A large, tall, or layered plate compresses visually, and the model appears to guess conservatively rather than risk a wildly high number.
That means the error is not evenly spread across your week. A single bowl of soup might come back close. A stacked dinner plate is the one more likely to be quietly undercounted.
Oil, butter and sauces disappear into a dish's surface sheen, and a photo cannot show how much went into the pan. The hospital-meal study found fat overestimated by 33.8% to 52.3% across models, a statistically significant bias (p<0.01) (Isobe et al. 2026, Nutrients).
Accuracy within ±10% of the measured value tells the same story from another angle: 46.7% to 73.3% of meals for energy, but only 6.7% to 33.3% for fat.
This is a mechanism, not a flaw in judgment. A model can see glisten and infer "oiled," but it cannot see the tablespoon that produced it. You can work out the oil and sauce calories a photo can't show using a free cooking oil calorie calculator that starts from what actually went into the pan, rather than from how shiny the plate looks.
Not necessarily, and this matters more than any single error figure. A 2026 study designed specifically to test this ran the same meal images through large language models 60 times each, then compared how much predictions varied within one image against how much they varied across different photos of the same meal (Wang, Lane & Waki 2026, JMIR Diabetes).
The researchers built this method because repeated queries on an identical photo do not converge on one fixed number. The O'Hara study confirms the gap from the other side, stating plainly that testing reproducibility was beyond its scope (O'Hara et al. 2025, Nutrients).
For a one-off curiosity, that variability barely registers. For daily tracking, where you want today's number to mean the same thing as yesterday's, it is a real problem. If you want the wider picture across AI calorie tools, not just ChatGPT, see how these numbers compare across AI calorie apps generally.
A chat window answers a single question and then forgets it. It has no log, no history, and nothing to edit before the number is saved somewhere permanent.
Avocalo works from the same kind of vision-model reading of a photo, with no accuracy figure claimed beyond what the studies above show for the underlying method. The difference is what happens after the estimate appears: you can review and edit it before saving, and it stays in a running log instead of vanishing at the end of the conversation. You can log a meal photo, then edit and keep it in a running history inside the app.
For context on how the underlying industry is moving, MyFitnessPal launched an app inside a new ChatGPT Health experience in January 2026, offering macro guidance, personalized targets, weight-management support and recipes from its food database (MyFitnessPal press release). That is a database lookup for guidance, not a photo-estimation feature, and it does not change any of the figures above.
Use it for a rough, one-off estimate, especially on a plate with one or two visible foods and no hidden sauce. The published error rates suggest that is where it holds up best.
Be more skeptical on a stacked plate, a fried or sauced dish, or any meal you plan to compare against tomorrow's. That is exactly where the cited studies show the biggest gaps, and where asking twice may not even give you the same number.
Pitfalls that quietly break the result:
The cited studies test meal photos, not label photos, so no sourced figure applies here. A printed label already states the calories and macros, which sidesteps the portion-guessing problem a plated meal creates entirely.
None of the three cited studies tested a two-step, ingredients-first prompting method, so there's no sourced figure either way. The underlying limitation, no scale reference in the photo, remains regardless of how the question is phrased.
No. It launched in January 2026 offering macro guidance, personalized targets, weight-management support and recipes from MyFitnessPal's food database, not a photo-estimation feature. It is a database lookup tool, distinct from the vision-model photo analysis this article discusses.
The Isobe et al. 2026 study included GPT-4o among the three top-performing models analyzed in detail and found fat correlation of 0.41 to 0.48 across them, without singling out one version as clearly superior. No study in this brief isolates a version-by-version accuracy ranking.
None of the cited studies tested prompting with a stated oil amount, so there's no sourced figure for this. Telling it the quantity removes the guesswork the studies show is the actual source of the fat-overestimation bias.
Published by Petros IT Solutions SRL. Spotted an error? Write to [email protected].